NAHB Reports Mixed Sentiment Among Multifamily Developers in Q3
November 13, 2024
Commercial and Multifamily Borrowing Surges 59% in Q3
November 19, 20242024 Rent Growth: An In-Depth Analysis
Throughout 2024, the ALN blog and monthly newsletters have diligently tracked multifamily industry performance, paying particular attention to the impact of new supply and the steady improvement in apartment demand that began in early 2023.
While the effects of supply and demand—as well as changes in average occupancy—on rent growth have been touched upon, they have not been examined in detail. With the year drawing to a close, now is an opportune time to assess recent trends in rent performance.
Data Context (click for PDF)
The figures cited pertain to conventional properties of at least 50 units, and references to average rents indicate rents for new leases.

Historic Demand and Shifting Dynamics
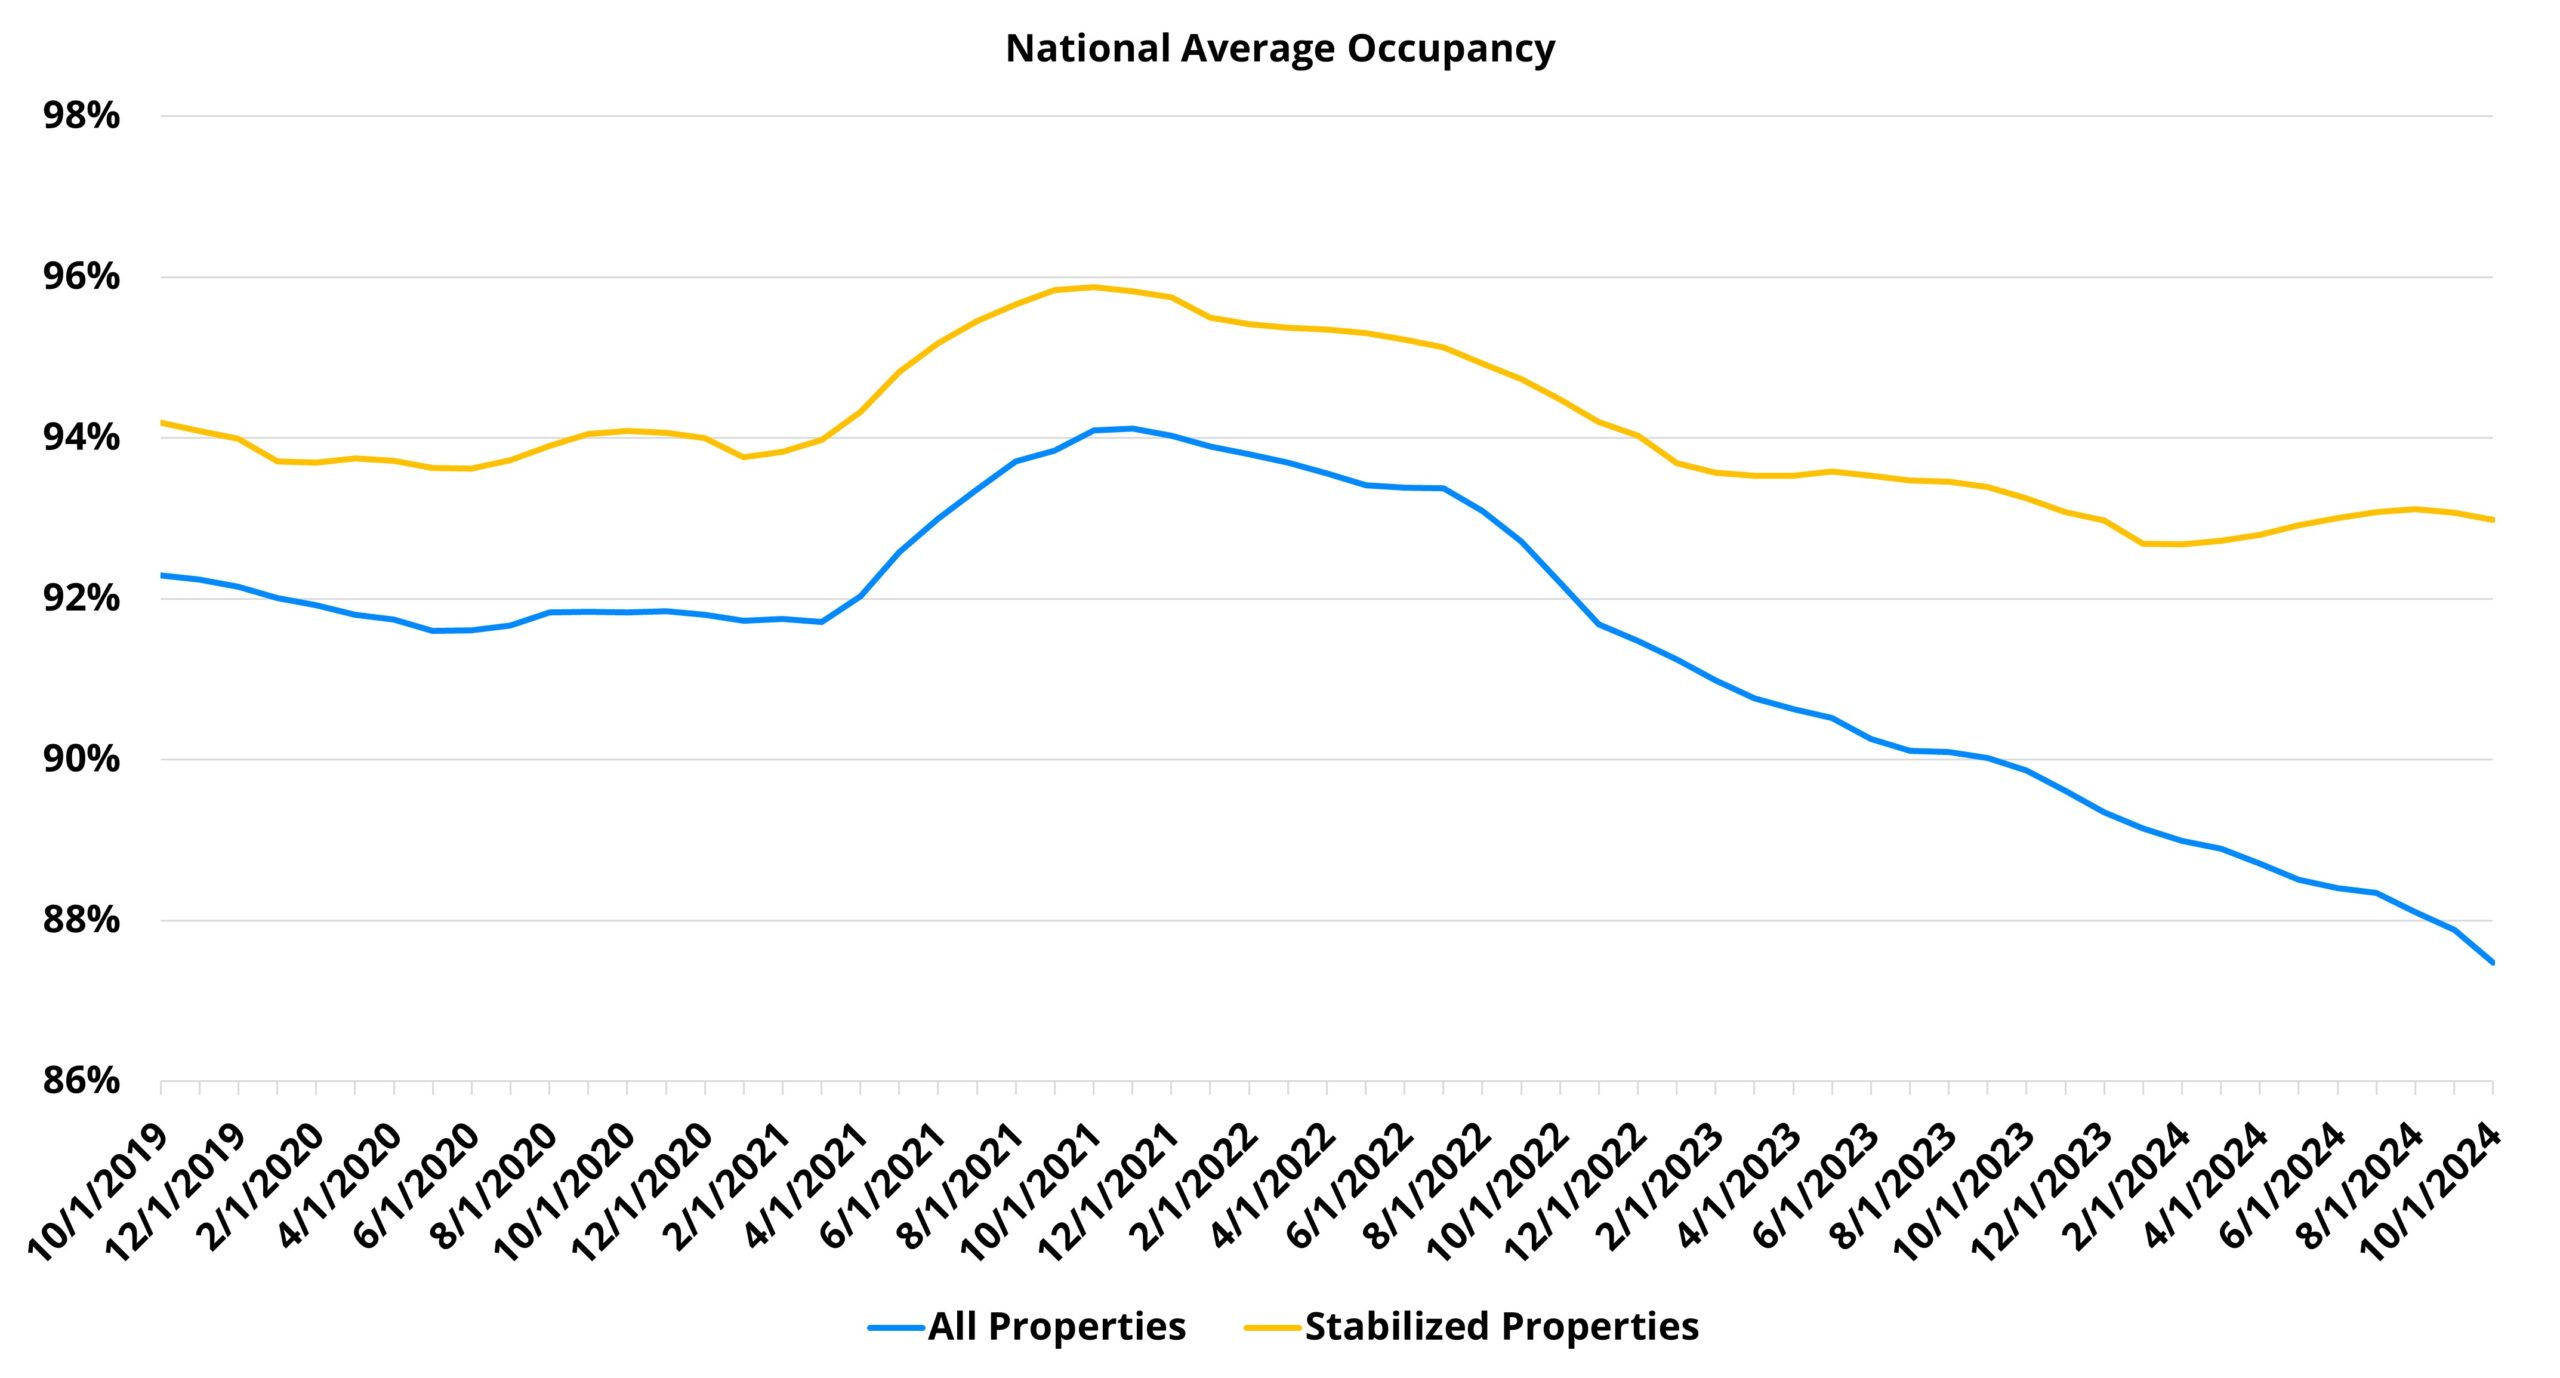
In 2021, record apartment demand drove net absorption above 650,000 units nationally. However, this momentum shifted dramatically in 2022 due to a combination of factors, including the residual effects of 2021’s extraordinary demand, rapid rent growth, the cessation of stimulus payments, and other variables. As a result, national net absorption in 2022 fell to under 75,000 units.
Simultaneously, new construction output was already increasing, pushing more units into the market. The combination of surging supply and diminished demand led to a 270-basis point drop in national average occupancy by the end of 2022.
Despite declines in occupancy and demand, average effective rent for new leases grew by 8% in 2022, bolstered by a strong starting occupancy level. However, rent growth slowed significantly by 2023 as continuous new supply eroded average occupancy further, limiting rent growth to a modest 1.1% for the year.
2024 Rent Growth Overview
Despite some recovery in apartment demand this year, it has not kept pace with the influx of new units, leading to further declines in average occupancy. As a result, rent growth in 2024 has been similar to 2023.
Nationally, the average effective rent for new leases increased by 2.3% through October, surpassing the 1.8% gain during the same period in 2023. Notably, the improvement was driven by performance in the late summer and early autumn. While average effective rent change underperformed or matched 2023 figures in six of the first seven months, growth turned positive in September and October. October’s 0.2% increase outpaced the 0.1% gain seen in September.
This late-year boost, while noteworthy, is not expected to prevent a return to negative monthly rent growth in the coming months. However, the recent gains could enable 2024 to end ahead of the 2023 annual growth rate.

Market Segmentation Insights

Rent growth trends have varied significantly by market segment and region. By price class, all tiers except Class D experienced year-over-year improvement. The strongest growth was seen in Class A properties, where average effective rent increased by 2.7% through October—more than three times last year’s growth for the same period. Class B properties also showed a substantial increase of 2.5%, doubling their prior-year performance.
Regional differences have also been pronounced. The Midwest, particularly the Great Lakes region, has outperformed national averages, benefiting from lower rates of new supply that allowed occupancy levels to remain relatively stable. Cities like Cleveland-Akron, Chicago, Kansas City, Columbus, Cincinnati-Dayton, Indianapolis, and Detroit saw average effective rents rise between 4% and 6% so far this year.
Key Takeaways
With new supply reaching unprecedented levels and national net absorption significantly negative, it is no surprise that most attention has been on supply and demand metrics, as well as occupancy challenges. However, there are positive takeaways in rent performance.
Steady demand improvements have helped slow the decline in rent growth and even reversed it slightly in the latter part of the year. Rent growth persisting later into the year compared to 2022 and 2023 signals potential for more stability. Although monthly rent growth may turn negative soon, the outlook for 2025 could see rent growth surpassing 3%, contingent on reduced new deliveries and ongoing demand recovery.
Connect With Our Experts
Leverage multifamily data insights to drive your business forward—schedule a call with our experts today for tailored analysis and strategies.
*Disclaimer: The information provided is for informational purposes only. ALN Apartment Data does not guarantee the accuracy or completeness of this content and will not be held liable for any losses or damages resulting from its use. Content may be shared with appropriate credit and a link to the original article or site.*


