2024 Trade Show & Maintenance Marathon
October 16, 2024
CAI’s New Website: A Streamlined Experience for Industry Professionals
October 25, 2024
Encouraging Developments in Multifamily Housing: Q3 Insights
As the third quarter wraps up, 2024 is nearing its close. Despite ongoing challenges, the industry performance data offers encouraging signs. Notably, apartment demand showed strong improvement, continuing its recovery from generational lows.
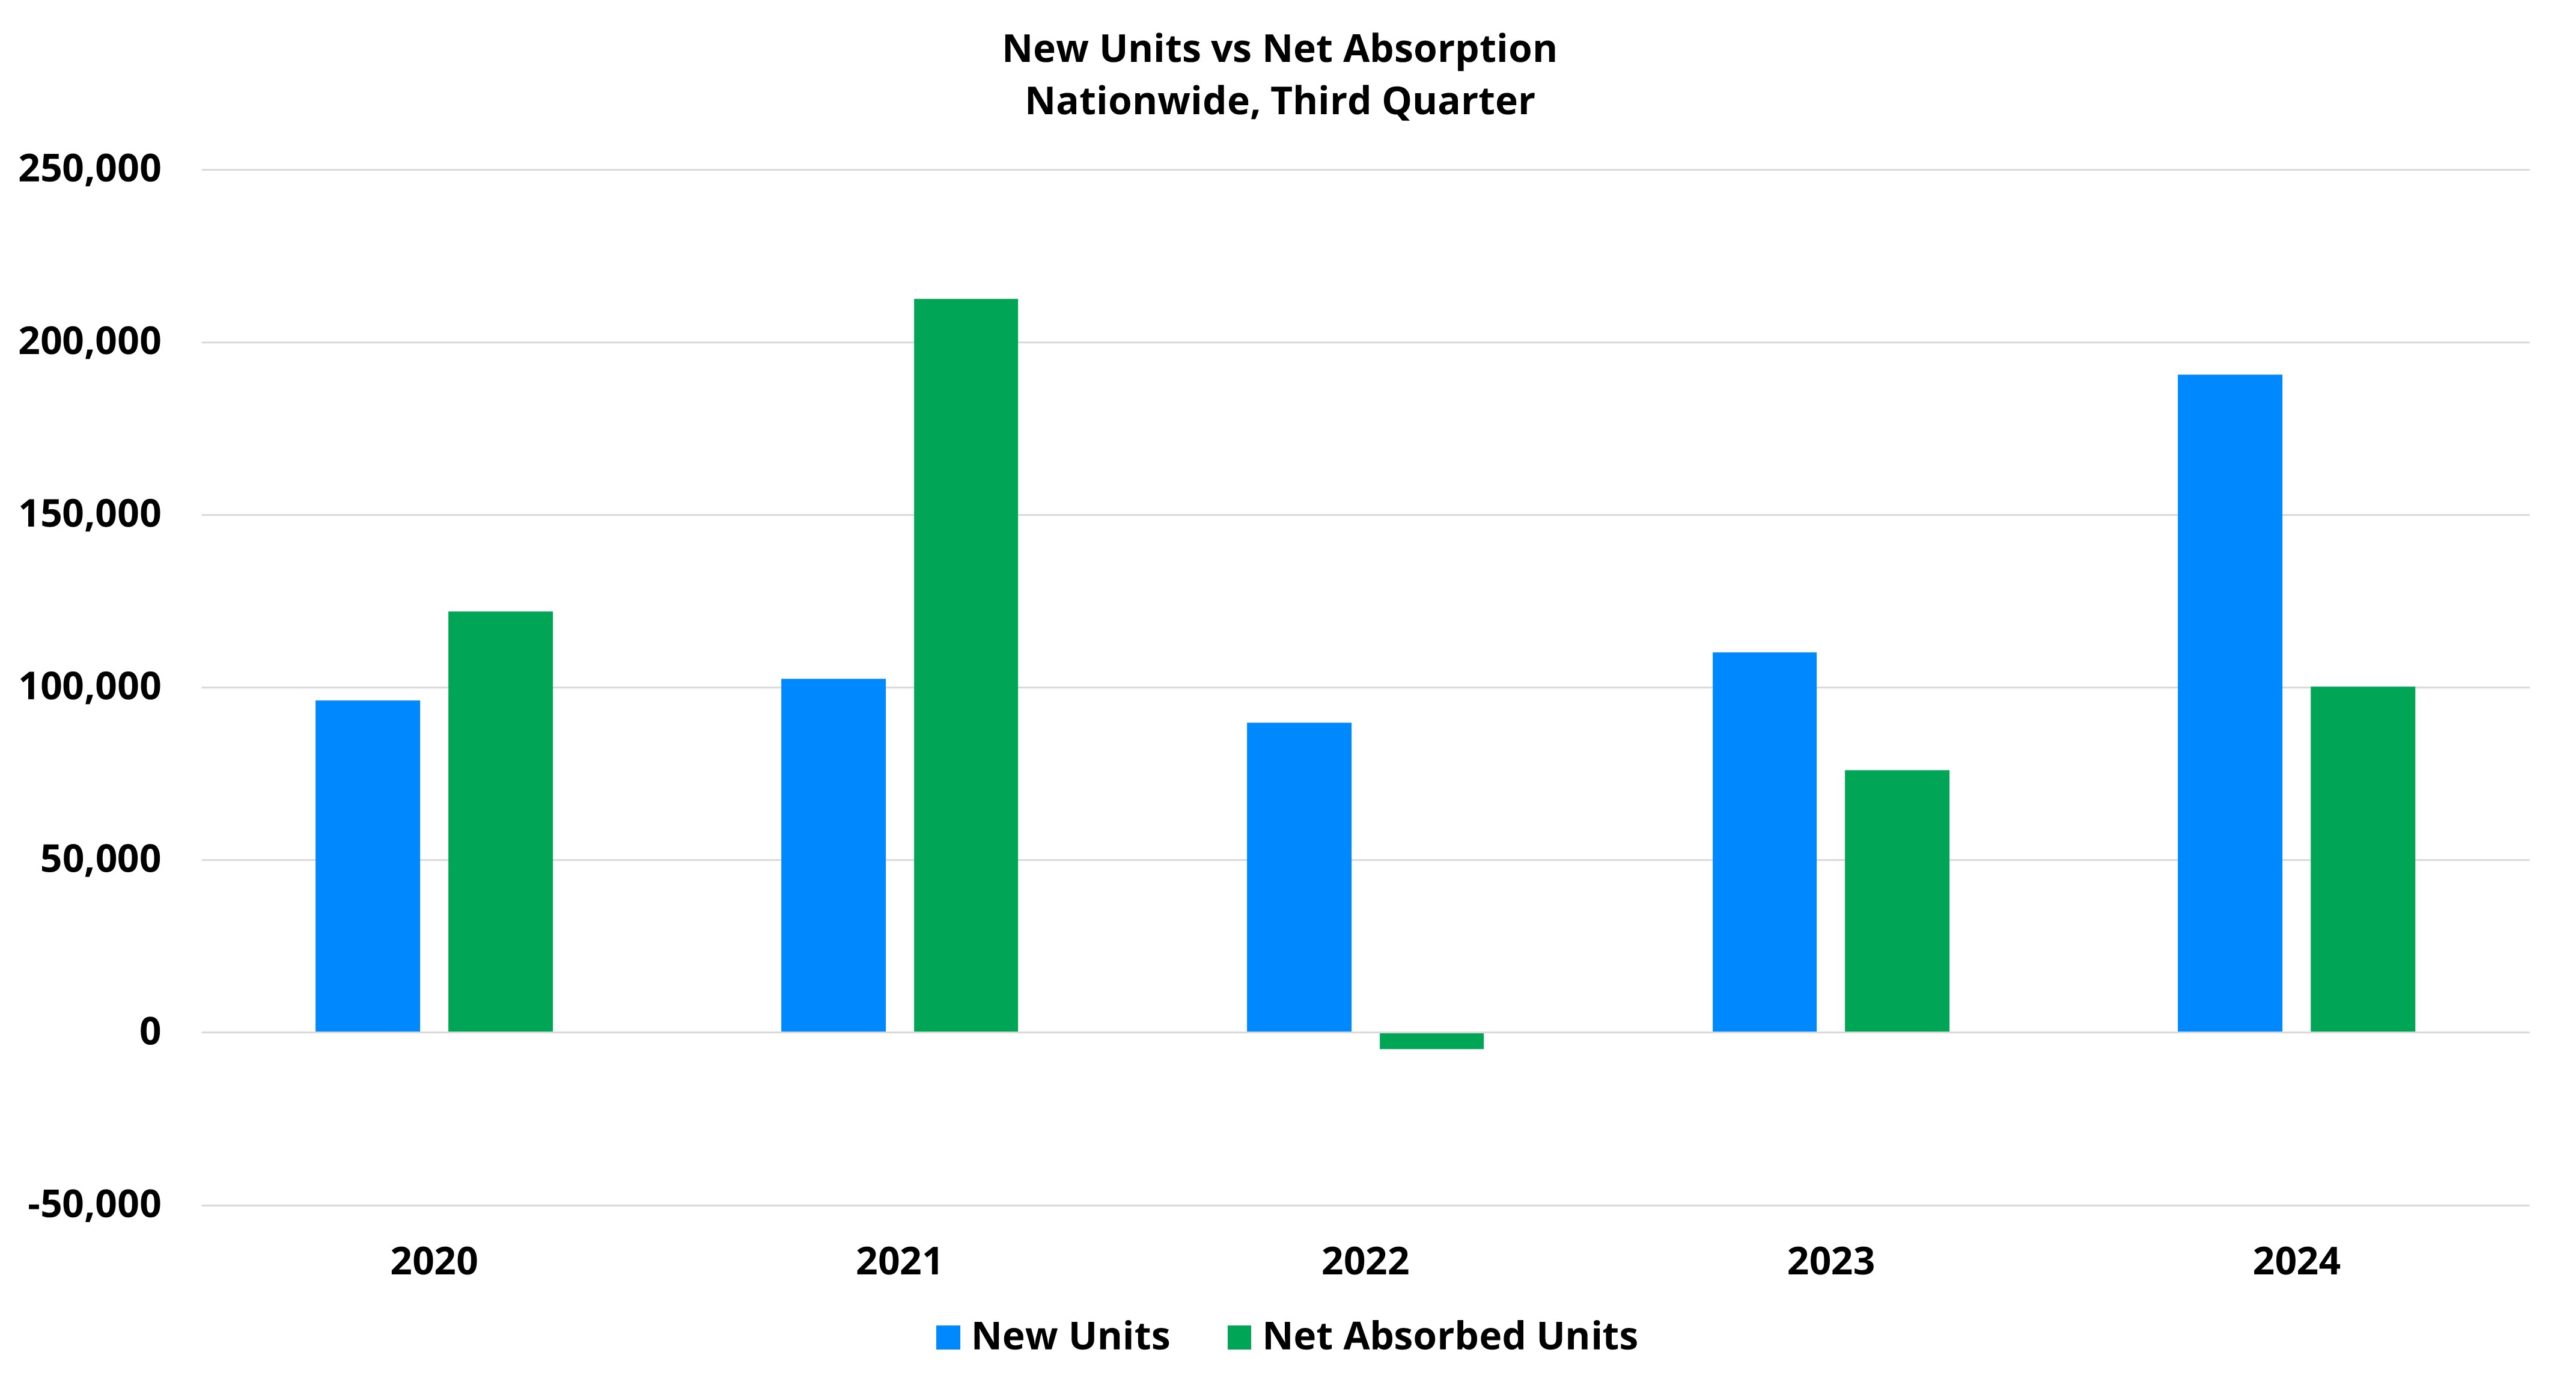
As expected, the multifamily new construction pipeline delivered a substantial number of new units this quarter. 2024 is likely to mark the peak for national deliveries in this development cycle, with the third quarter seeing more new units than any quarter in recent years. Approximately 191,000 new units were introduced nationwide, up from around 162,000 in the second quarter. In total, about 475,000 new units have been added in just nine months this year—a figure that would have been considered an impressive total for an entire calendar year in the previous decade.
The standout for industry performance this quarter was apartment demand. More than 100,000 net units were absorbed during the period, with absorption improving steadily throughout the year, following the typical seasonal trends for multifamily. The third quarter's total was the highest of any quarter since 2021. These strong results suggest that, after experiencing net losses in leased units during the final quarters of 2022 and 2023, this negative streak may come to an end in 2024.
Net absorption among stabilized properties (those that entered the year already leased) was particularly encouraging. In recent years, demand has been concentrated in lease-up properties. In fact, both 2022 and 2023 saw negative annual net absorption for stabilized units. However, through the first three quarters of 2024, stabilized net absorption has totaled around 59,000 units.
While stabilized net absorption typically peaks in the second quarter and overall net absorption peaks in the third quarter, this pattern held in 2024. Stabilized absorption did decline slightly from the second to third quarter, but the third-quarter total still outperformed not just 2022 and 2023, but also 2017 and 2019.
Average Occupancy
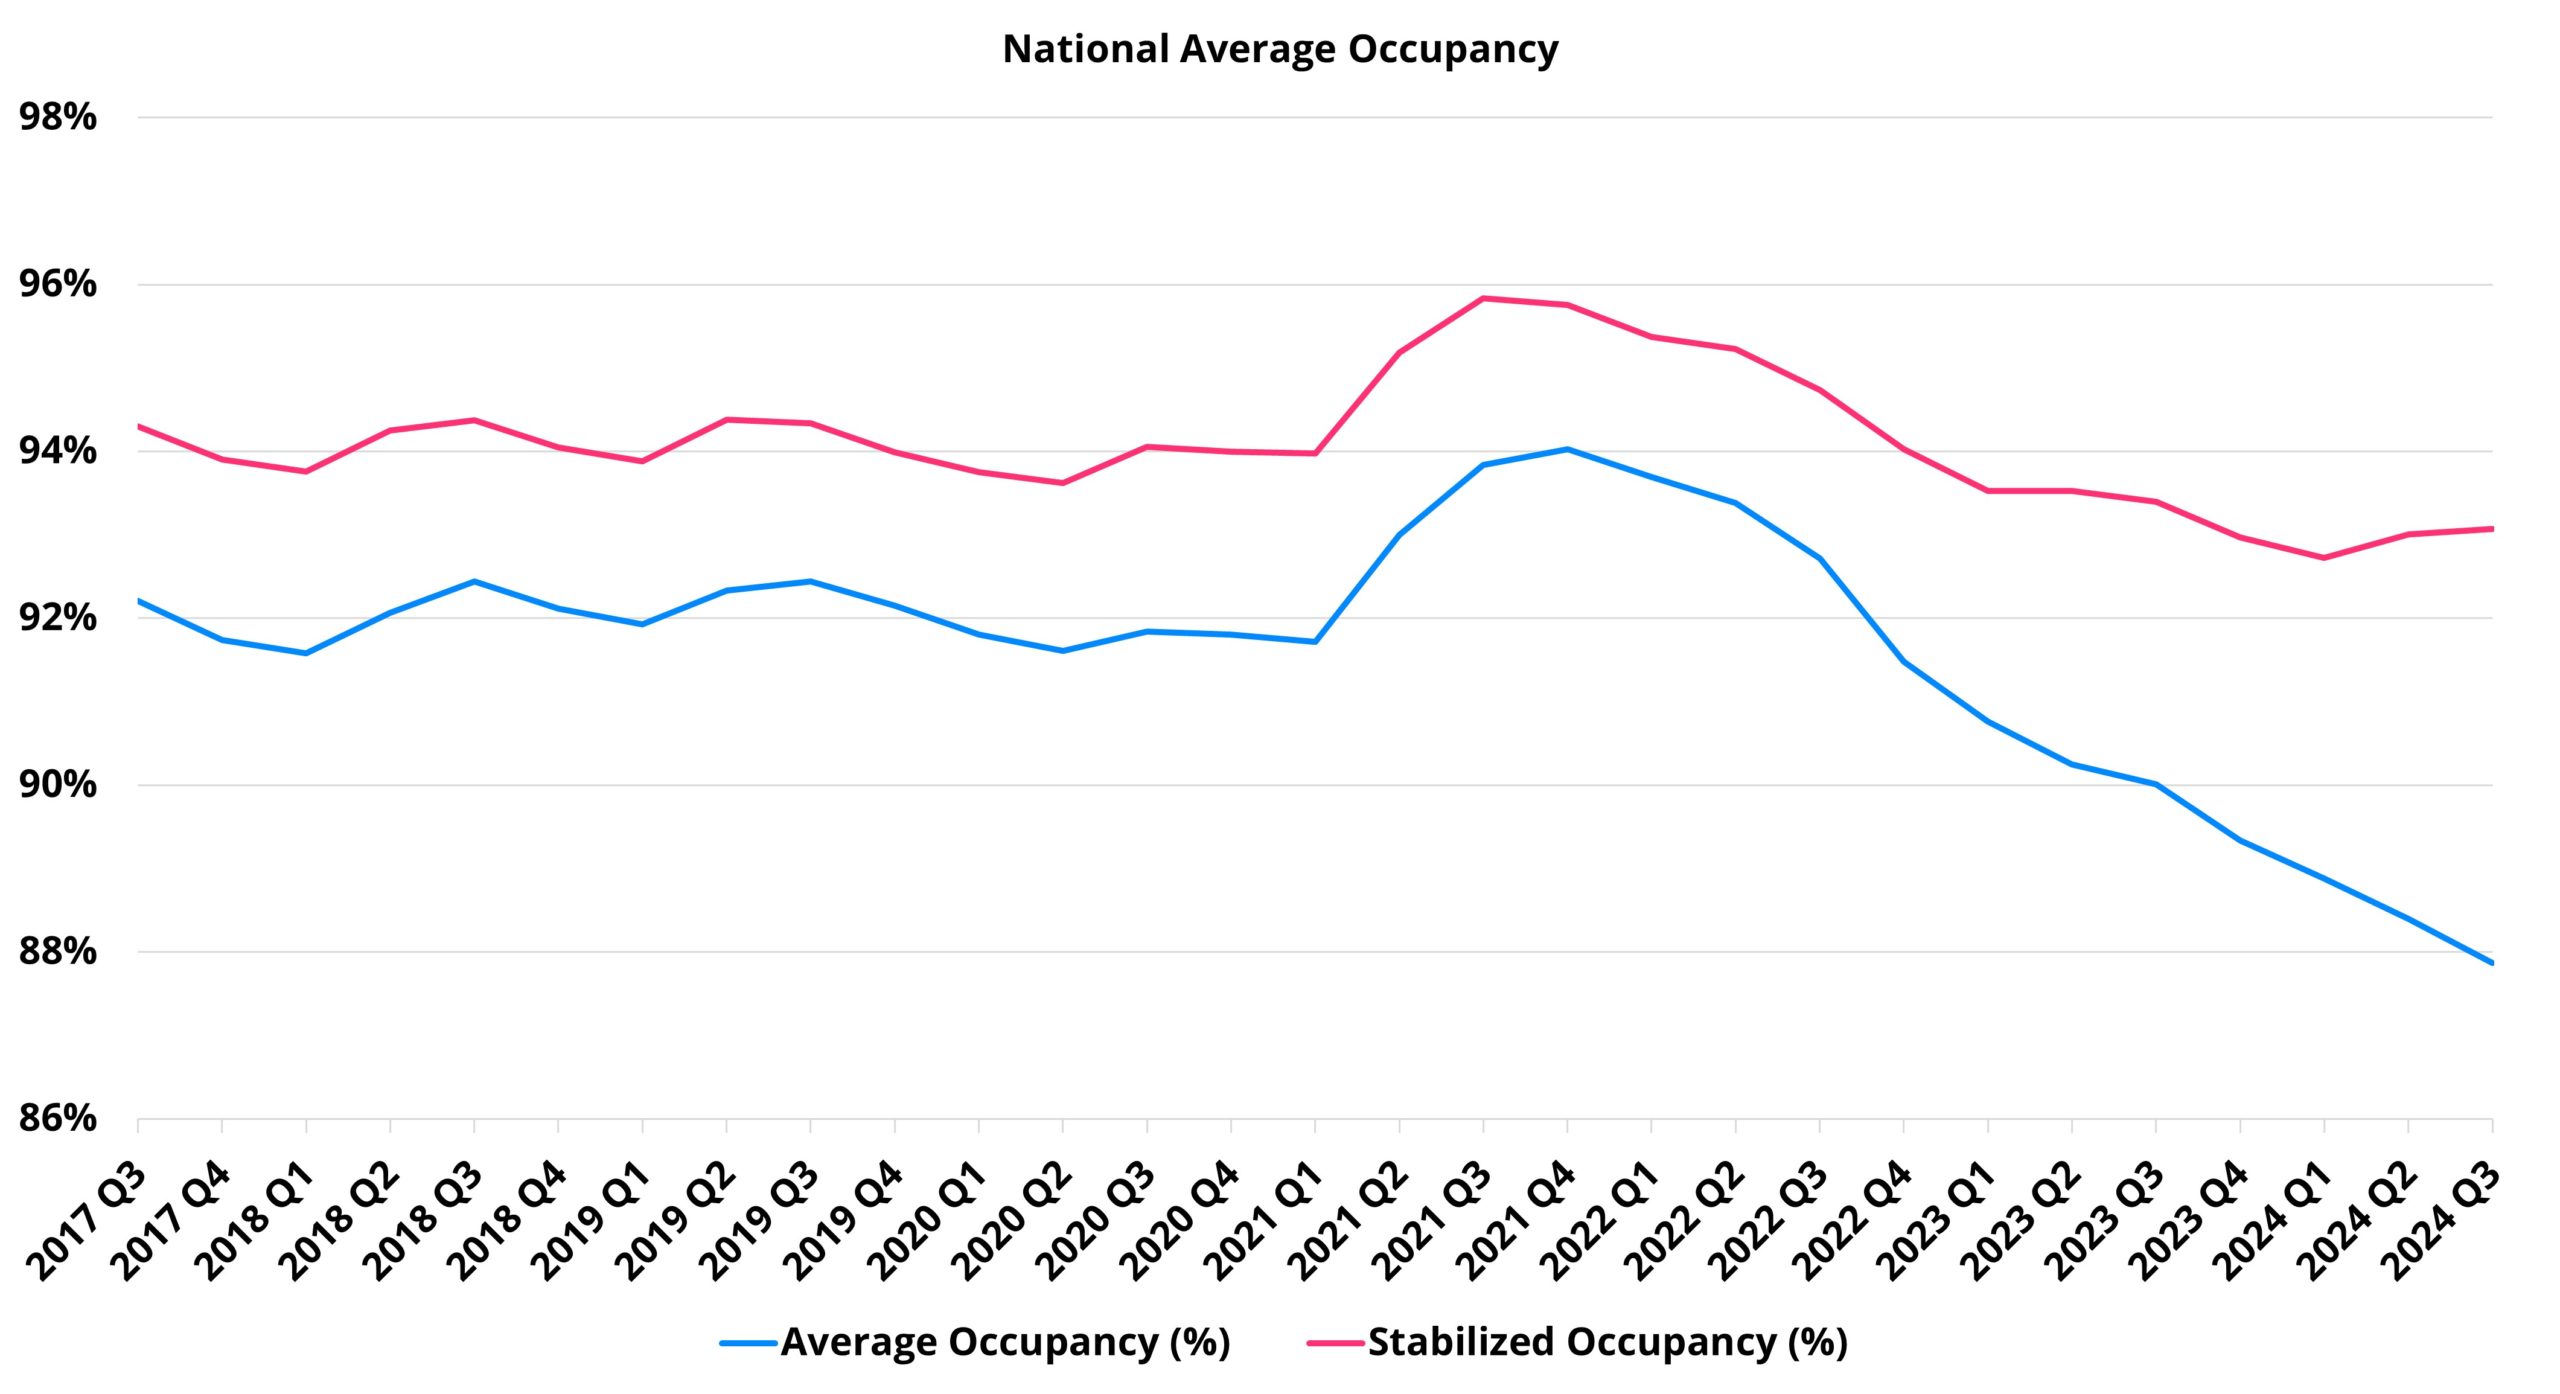
Despite improved apartment demand, average occupancy continued to decline due to the influx of new supply. A 60-basis-point drop in overall occupancy during the quarter brought the national average down to 87.9% by the end of September.
On a year-over-year basis, the 2.3% decline over the past twelve months marked a slight improvement from the 2.9% drop in the previous year. With new supply potentially increasing in the final quarter and apartment demand expected to cool from its third-quarter peak, national average occupancy likely hasn’t hit its low point for 2024 yet.
For properties that were stabilized at the start of 2024, a 0.1% increase brought average occupancy to 93%. Though modest, this gain marked the third consecutive quarter without an occupancy decline, a trend not seen since 2021.
Similar to overall occupancy, the stabilized rate is expected to decrease in the final quarter, though at a more moderate pace. Stabilized net absorption has been negative in the fourth quarter for the past seven years and is likely to follow the same pattern this year. However, the improvement in stabilized net absorption and the corresponding shift in the occupancy trend have been key developments for the multifamily industry in 2024.
Average Effective Rent
While apartment demand has improved this year, it has come at the cost of rent growth. Average effective rent increased by just 0.6% in the third quarter, bringing the annual gain to 1.1% over the last twelve months—both figures falling well below their long-term averages.
A key point in the rent performance data is the variation by price class. Rent growth has been most resilient in the higher-end segments of the market. For both Class A and Class B properties, third-quarter rent growth for new leases averaged about 1%, aligning with the typical rent performance seen between 2017 and 2019.
However, rent growth has been more subdued in the lower price tiers. Class C properties saw only a 0.3% increase, while Class D properties experienced a 0.5% decline in average effective rent. For Class C, this was tied with 2023 for the weakest third-quarter growth in recent years, and for Class D, it marked the first third-quarter decline in recent memory.
This quarter revealed a growing divide between the top two and bottom two price tiers. Rent growth at the higher end of the market was stronger and accompanied by improved demand. In contrast, the lower price tiers not only saw weaker rent growth but also experienced a decline in apartment demand compared to the previous quarter.

Lease Concessions
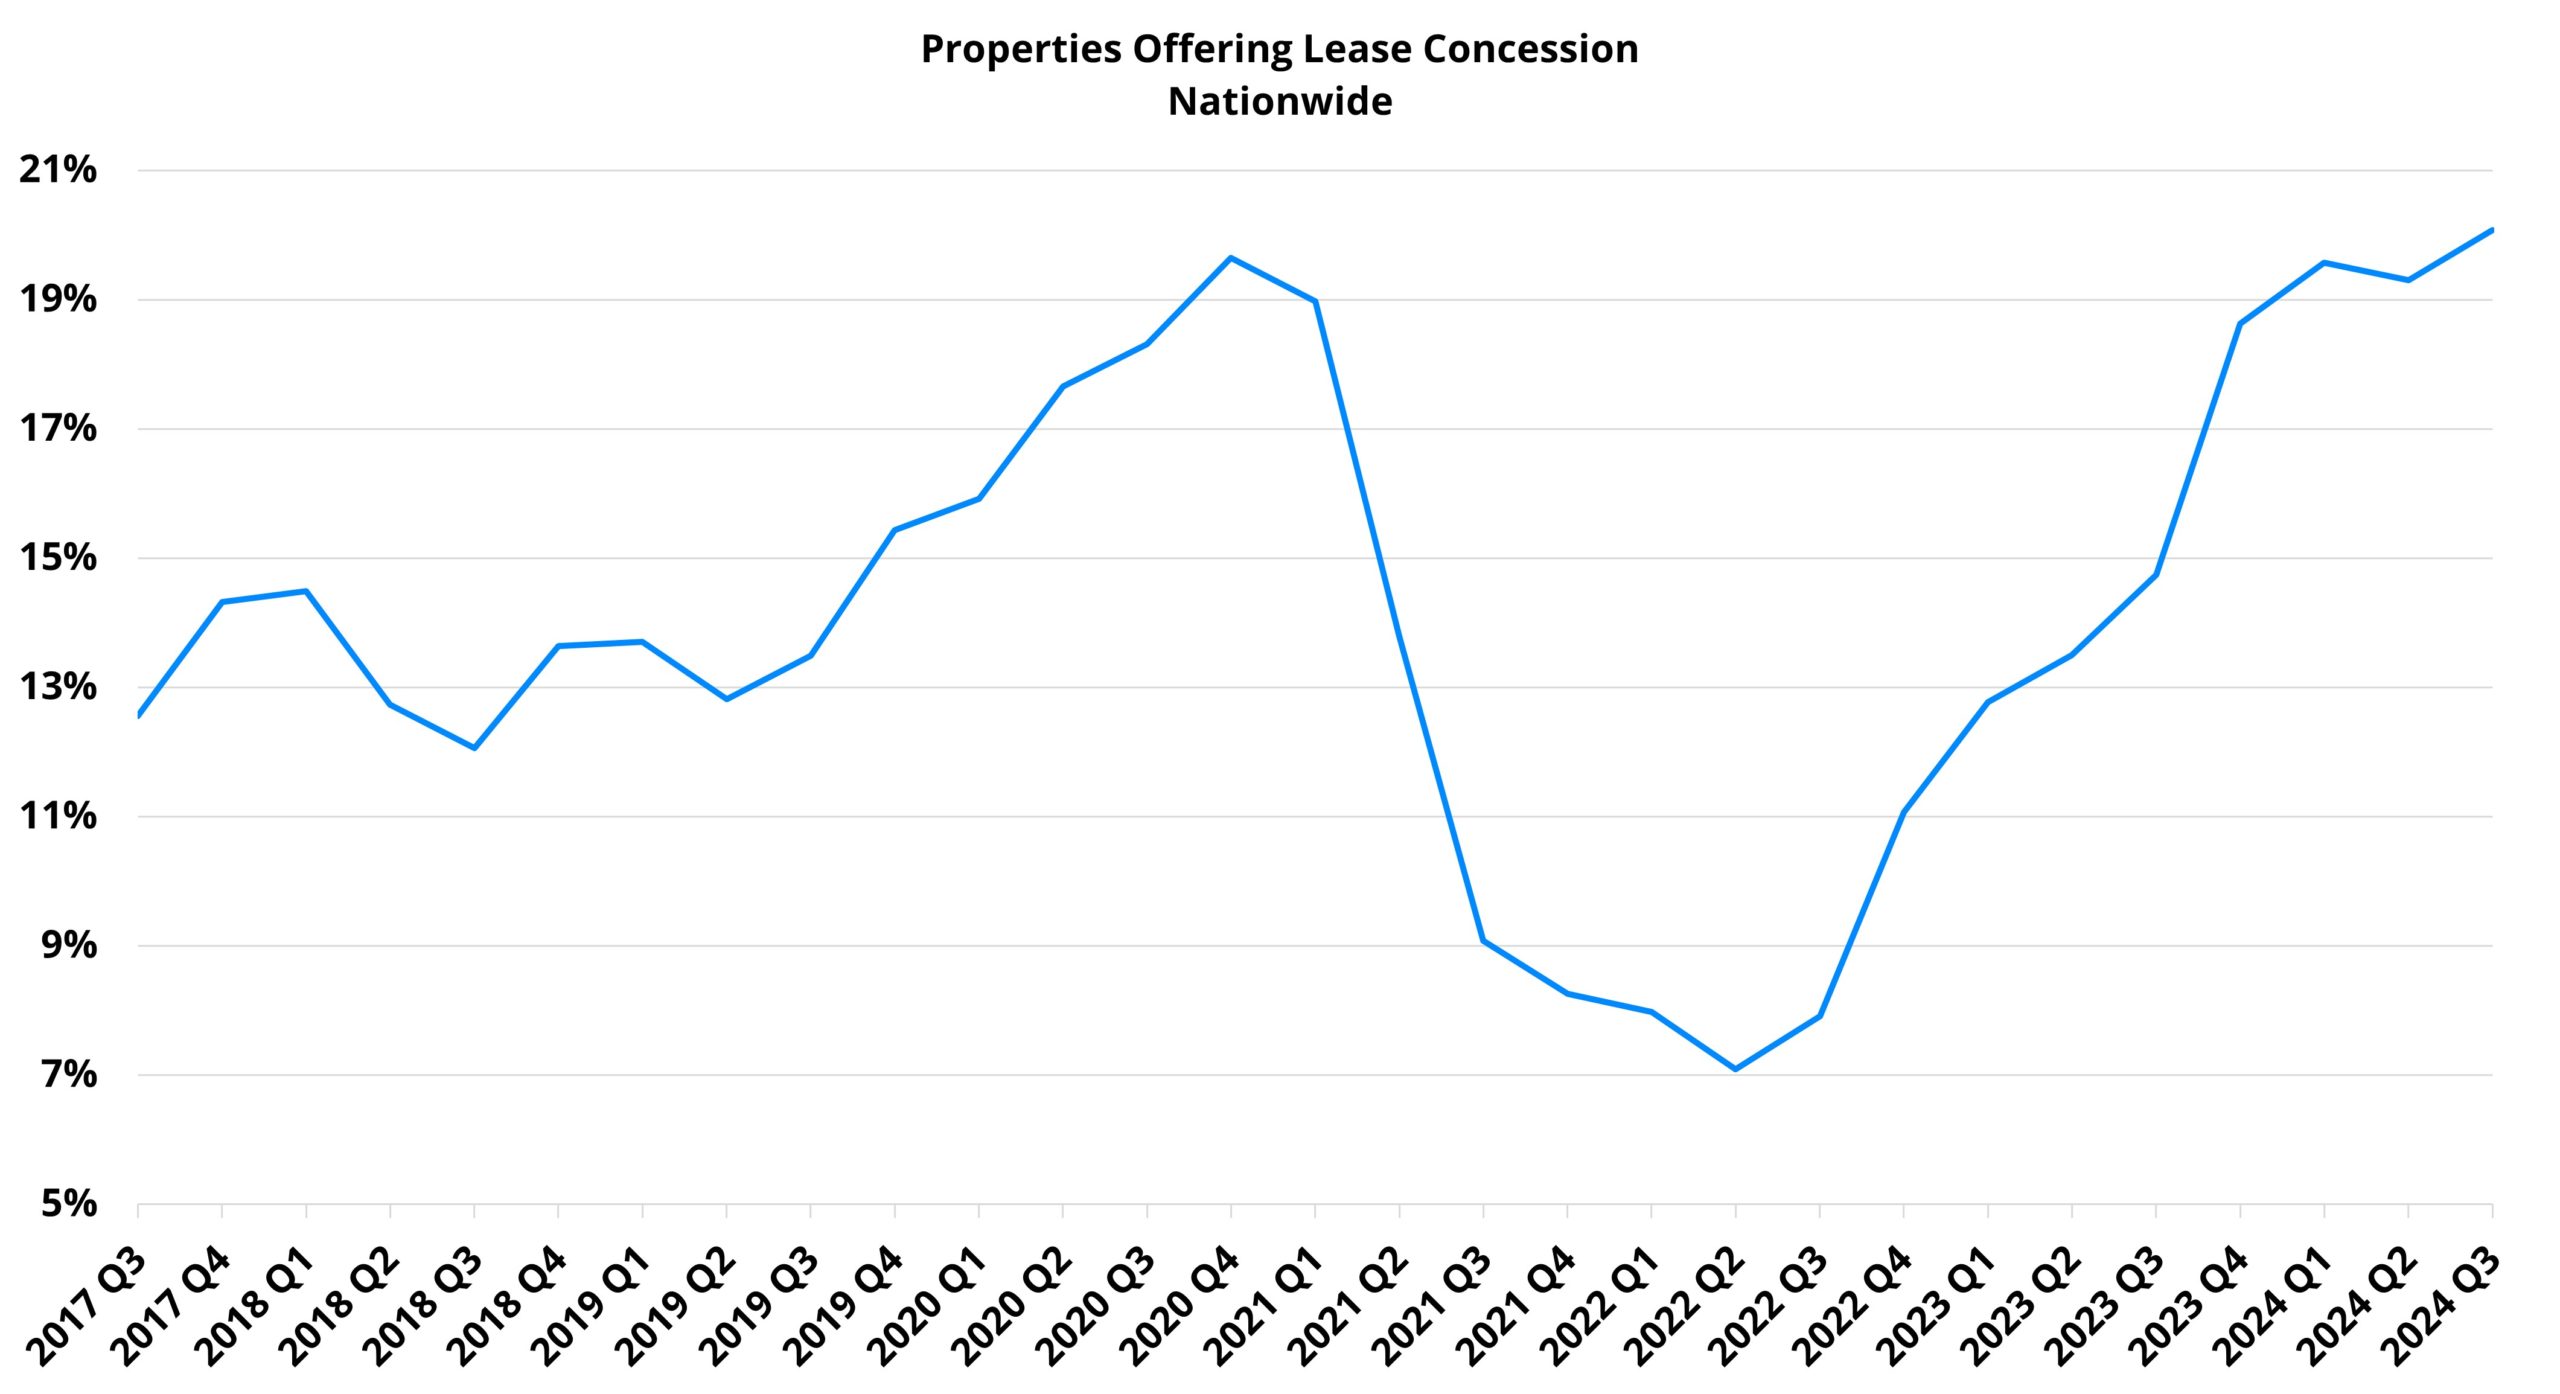
Lease concessions remain a significant factor in the rent growth narrative. The availability of discounts for new leases increased by 4%, which is less than the growth seen in the same period in 2022 and 2023. Conversely, the average lease concession value also rose by 4%, marking the largest increase for any third quarter since 2020.
As of the end of September, approximately 20% of conventional properties nationwide were offering discounts on new leases, reaching the highest concession availability in over seven years. Only the fourth quarter of 2020 and the first two quarters of this year were close to this level. It's likely that concession availability will continue to rise by year-end.
The average concession value for the period stood at about 3.6 weeks off an annual lease, also on the higher end of its recent range. This figure hasn’t been this elevated since the peak in late 2020 and early 2021. While an increase is expected in the fourth quarter, 2024 is projected to avoid reaching the pandemic-era peak when average discounts exceeded four weeks off a twelve-month lease.
Takeaways
The third quarter brought some optimism for a multifamily industry that has struggled over the past few years. Apartment demand has demonstrated sustained and significant improvement this year, particularly in stabilized net absorption, which has shown promising progress. While below-average rent growth is not cause for celebration—especially amid rising operating expenses—the cooler rent growth has coincided with a positive response in demand.
Nonetheless, challenges persist. The new construction pipeline is unlikely to ease until the second half of 2025, which means average occupancy will face difficulties in recovering the ground lost over the past three years in the coming months.
Moreover, despite real improvement over the last twelve months, net absorption and rent growth for Class C and Class D properties remain well below pre-pandemic levels, especially for Class D. Although these segments are trending in the right direction, further progress is essential.
*Disclaimer: All content and information within this article is for informational purposes only. Think Construction Services makes no representation as to the accuracy or completeness of any information in this or any other article posted on this site or found by following any link on this site. The owner will not be held liable for any losses, injuries, or damages from the display or use of this information. All content and information in this article may be shared provided a link to the article or website is included in the shared content.
