
Navigating Insurance and Permitting for Multifamily Construction in Florida
March 6, 2025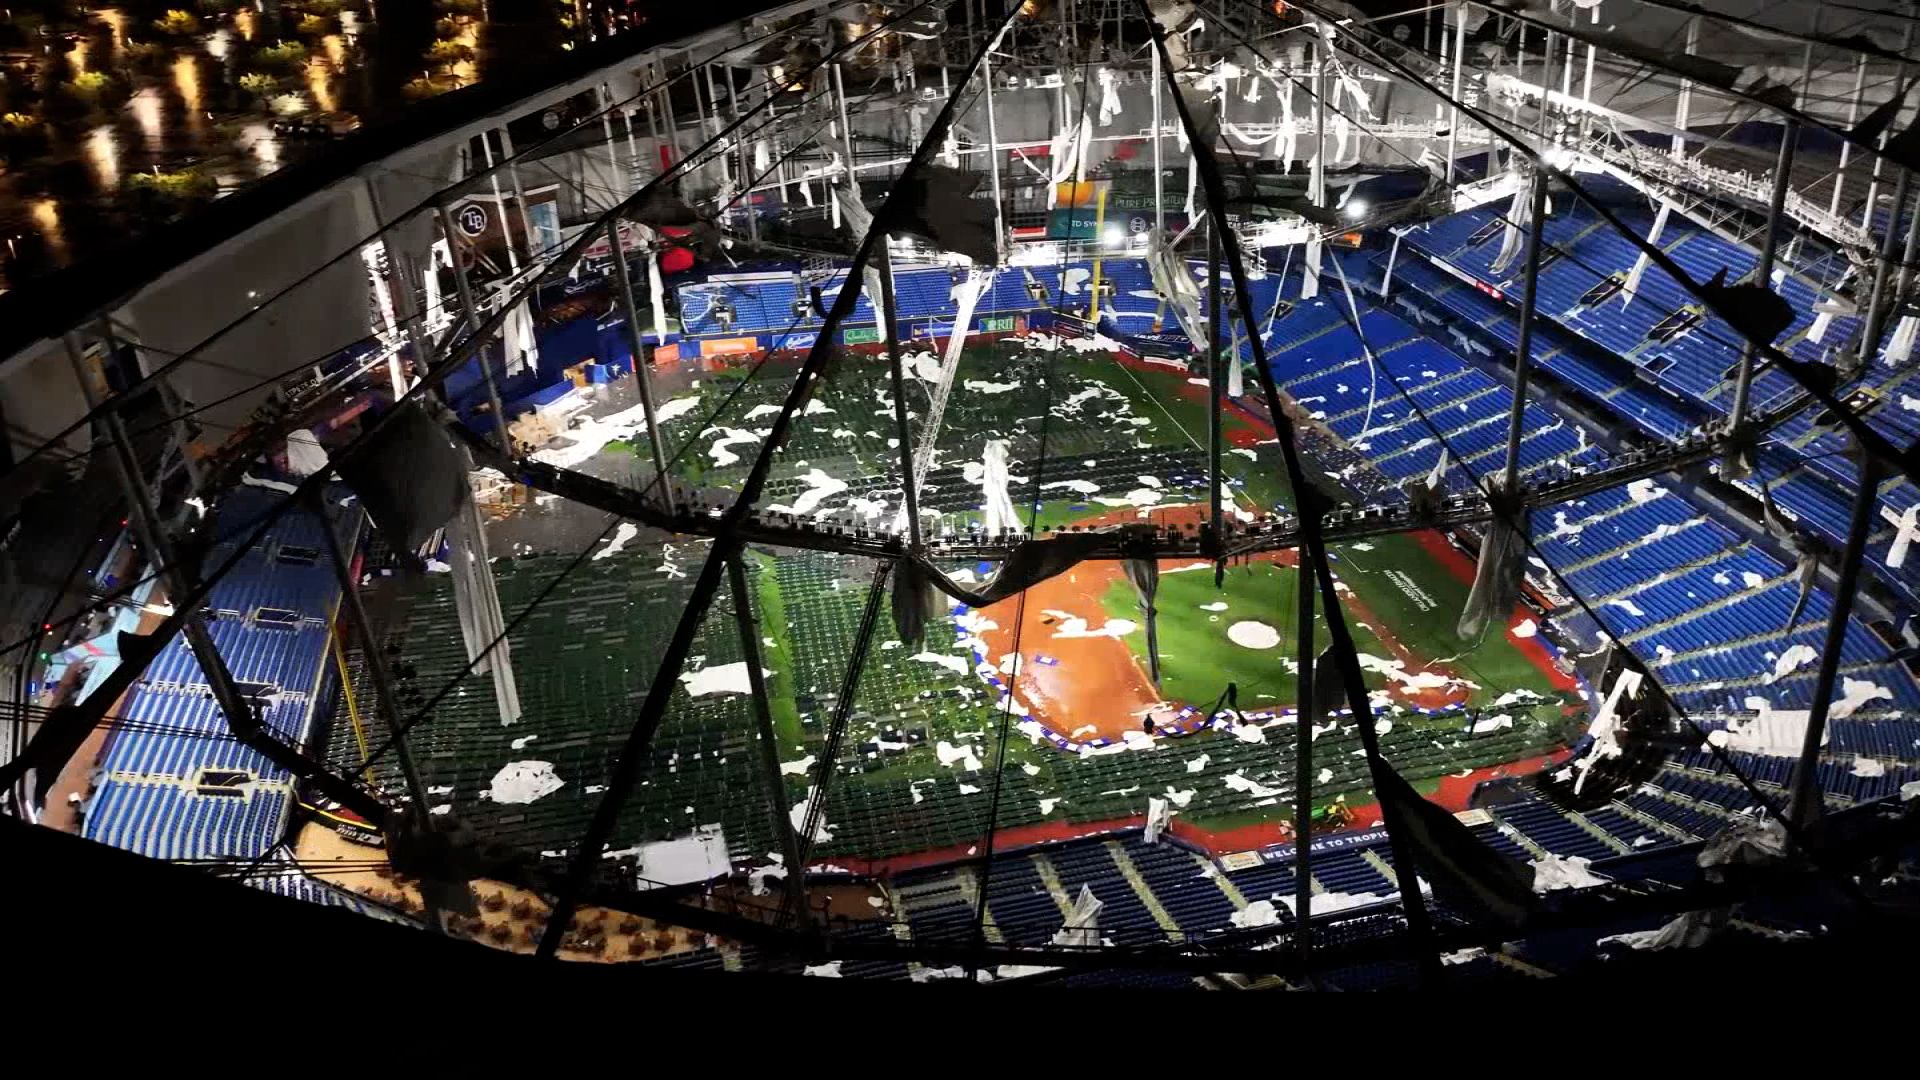
Blake Investment Partners Proposes $260M Cash Deal for Tropicana Field Land, Stadium Repairs
March 14, 2025
Strong Start for 2025 Amid Market Volatility
Despite a dip in January demand, the past three months have shown promising signs for the multifamily industry, offering early reasons for cautious optimism. While the year is still in its early stages, recent trends have largely aligned with expectations for 2025 across various key metrics.
All data referenced applies to conventional properties with at least 50 units.
Lower Supply, Rising Demand
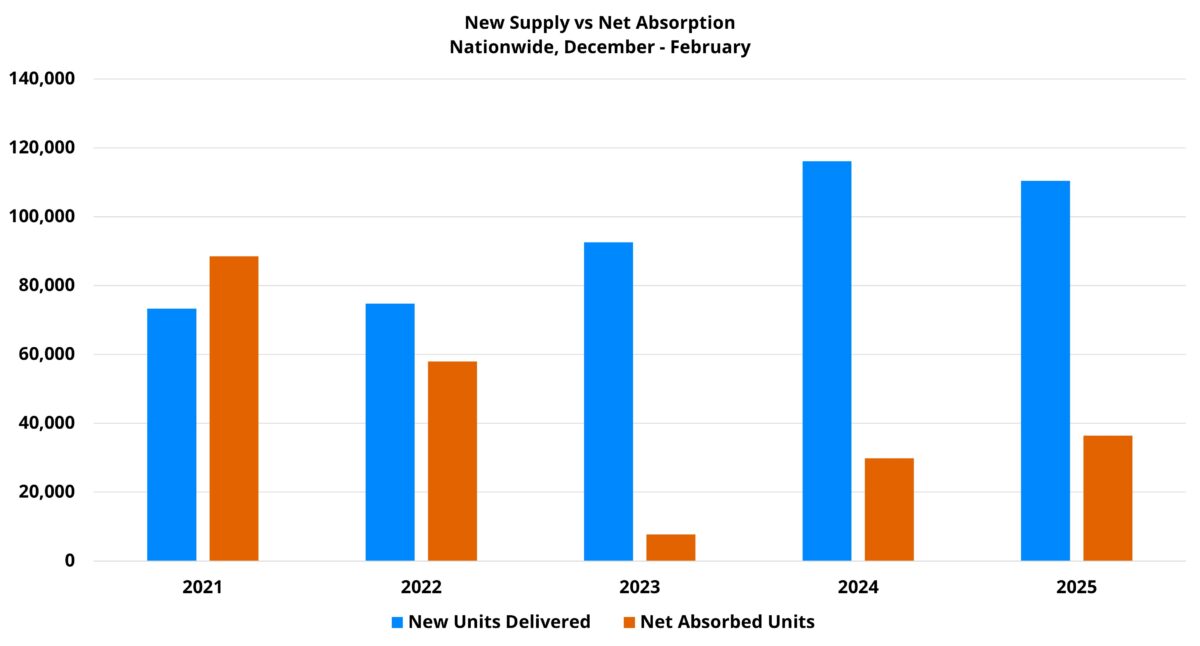
A key expectation for the multifamily industry in 2025 was an improving balance between supply and demand. While net absorption is unlikely to fully match new deliveries this year, absorption has been steadily closing the gap. This trend is driven by a moderate slowdown in national deliveries and the continuation of an apartment demand upswing that began in 2023.
From December through February, both dynamics have been evident in the data. More than 110,000 new units were delivered nationally during this period—a slight drop from the roughly 116,000 units delivered in the same timeframe last year. However, this remains well above the five-year average of 76,000 units for these months. While annual deliveries are expected to decline in 2025, new supply remains robust, keeping the industry highly active.
On the demand side, apartment absorption continued its positive trajectory. More than 36,000 net units were absorbed from December through February, marking a 22% increase from the previous year.
Notably, this strong performance came despite a sharp downturn in January, when more than 35,000 leased units were lost. However, the market rebounded in February, with a surge of approximately 61,000 net absorbed units. This level of volatility is typical in winter months, but February’s strong bounce-back is a positive indicator heading into spring.
One area of concern is the absorption trend in stabilized properties, particularly Class B and Class C assets. These segments experienced a net loss of nearly 30,000 leased units over the three-month period, highlighting a potential challenge in the market’s recovery.
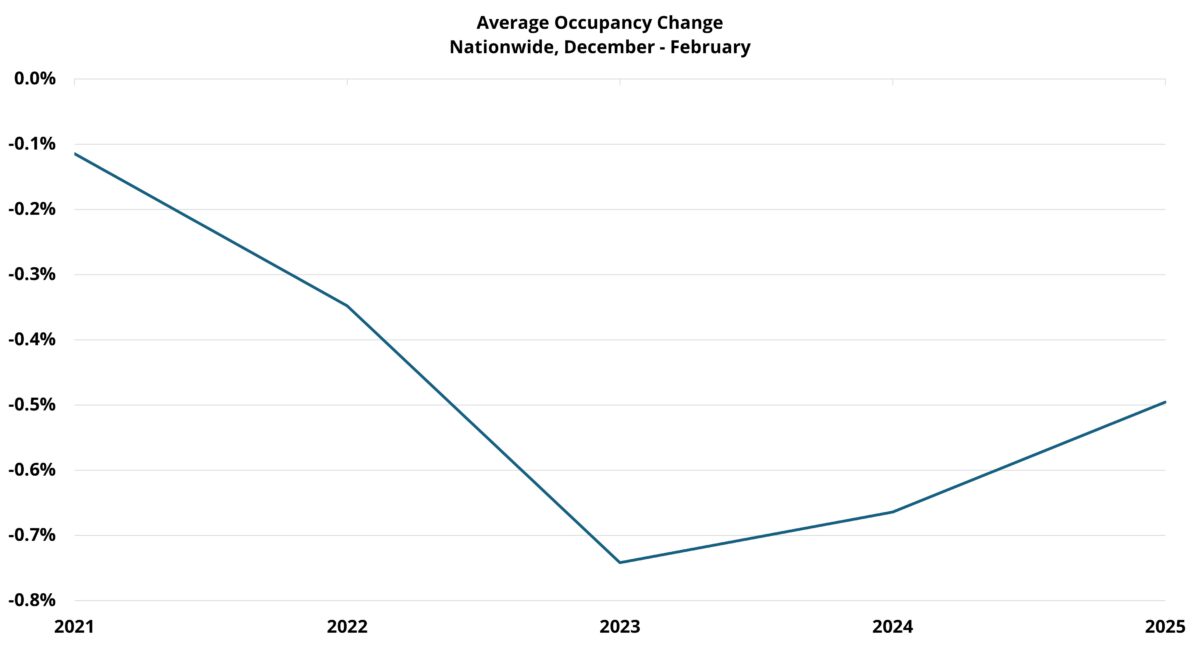
Occupancy Decline Moderating
As 2025 unfolds, expectations of lower supply and higher demand appear to be materializing. While these factors may not be enough to fully reverse the negative occupancy trend, they are helping to slow the rate of decline—just as anticipated.
Over the past three months, national average occupancy has fallen by 0.5%, bringing it to approximately 87%. This marks the smallest decline in the past three years and aligns with the seasonal fluctuations seen in 2018 and 2019, before the market experienced the volatility of recent years.
However, stabilized properties remain under pressure. A notable net loss of leased units led to a 0.3% drop in stabilized average occupancy—larger than last year’s 0.1% dip during the same period.
Despite this, the sharpest phase of occupancy contraction that began in late 2021 seems to be subsiding. A rebound in stabilized net absorption in 2025 would be a positive development, and given current trends, this could emerge by spring or summer. Additionally, the large backlog of newly delivered units in lease-up properties suggests that overall occupancy trends in 2025 may outperform 2024, even if stabilized properties continue to face some challenges.
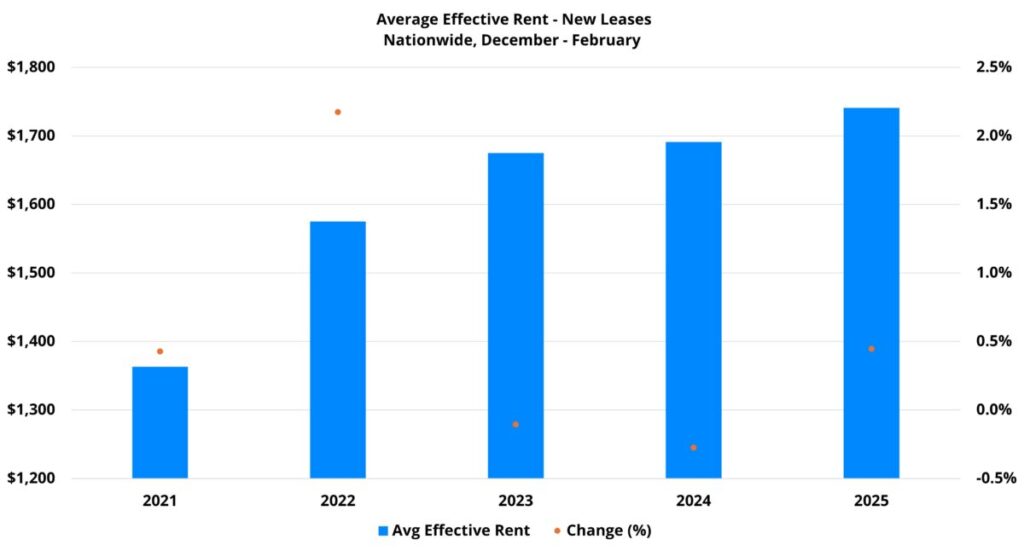
Rent Growth on the Mend
After two years of subdued gains, rent growth was expected to strengthen in 2025. Positive momentum from last year, combined with an improving supply-demand balance, set a more optimistic tone than in recent years.
Over the past three months, average effective rent for new leases rose by 0.4%—the strongest gain for this period in three years and well within the normal range observed over the past decade.
Widespread Improvement Across Segments
One encouraging trend has been the broad-based nature of the recovery. Despite ongoing demand challenges, stabilized properties saw year-over-year gains, returning to their long-term average. While demand remains a key factor, seasonal trends should provide support moving forward.
Rent growth by price class also showed broad-based progress. Class A and Class B properties posted the largest gains compared to last year, while Class C also saw improvement. Only Class D experienced a decline, though a silver lining emerged—its rent softening coincided with improved net absorption.
Lease Concessions Show Signs of Stabilization
Another promising indicator is the moderation in lease concessions. While concession availability typically rises in the winter months, the recent three-month increase was just 2%—the smallest in three years. In contrast, the past two years saw double-digit jumps in discount availability during the same period.
This slowdown could signal the early stages of a turnaround. If concession growth continues to moderate—or even decline—it would provide additional tailwinds for effective rent growth in the months ahead.
Disclaimer: The content and information provided in this article are intended for informational purposes only. Think Construction Services makes no representations regarding the accuracy or completeness of any information in this article or any other content posted on this site, nor for any information accessed through links provided. The company will not be liable for any losses, damages, or injuries resulting from the use or display of this information. All content within this article may be shared, provided a link to the original article or website is included in the shared content.


